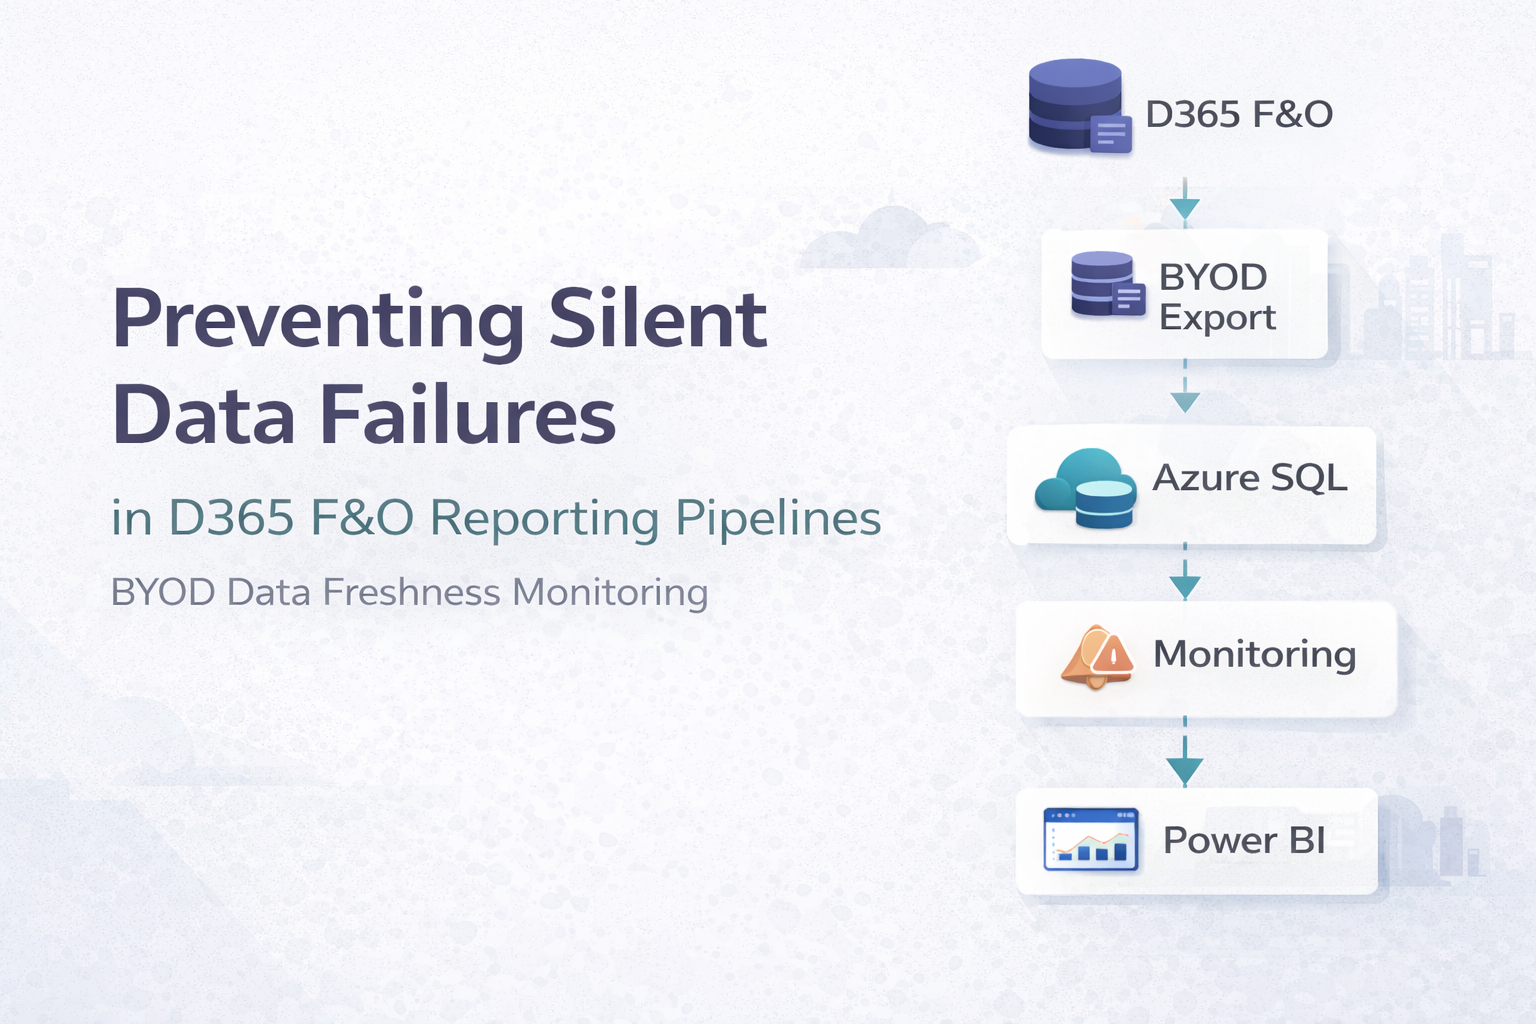
Designing a BYOD Data Freshness Monitoring Architecture
D365 reporting pipeline monitoring is critical in enterprise Dynamics 365 Finance & Operations environments because reporting pipelines can fail silently while Power BI reports continue to refresh.
Enterprise Dynamics 365 Finance & Operations reporting pipelines can fail silently while Power BI dashboards continue refreshing with stale data.
| Key Insight: In many enterprise environments, reporting failures are not caused by broken dashboards but by data pipelines that silently stop moving new data. |

In many enterprise Dynamics 365 Finance & Operations environments, reporting systems appear stable as long as reports continue to refresh successfully. Dashboards update on schedule, Power BI datasets complete their refresh cycles, and no system alerts are triggered.
However, there is a hidden failure pattern that many organizations discover only after business users raise concerns:
The reporting pipeline can silently stop delivering new data while the reporting platform itself continues to operate normally.
In other words, reports may refresh successfully while displaying outdated information.
This type of issue is not caused by broken dashboards or failed report refreshes. Instead, it occurs when the data pipeline feeding the reporting environment stops moving new data forward, even though the surrounding infrastructure appears healthy.
Understanding this risk is essential for organizations operating enterprise reporting platforms built on Dynamics 365 Finance & Operations, Azure SQL, and Power BI.
Designing a D365 Reporting Pipeline Monitoring Strategy
A Typical Enterprise Reporting Architecture
A common reporting architecture for Dynamics 365 Finance & Operations environments follows a multi-stage pipeline. Business transactions are generated inside Dynamics 365 and exported to an external reporting database through scheduled export processes. Data is then transformed and exposed to analytics tools.
| Dynamics 365 Finance & Operations |
| DMF Export to BYOD |
| Azure SQL Staging Tables |
| SQL Transformation / Business Logic |
| Reporting Tables |
| Power BI Gateway |
| Power BI Dataset Refresh |
| Business Reports & Dashboards |
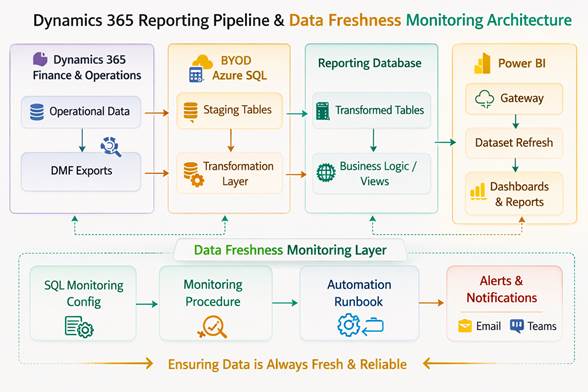
Figure 1. Example D365 reporting pipeline monitoring architecture.
Each layer in this pipeline performs an important role:
- Dynamics 365 produces operational data.
- Export processes transfer data to the reporting database.
- Azure SQL stores and transforms data for analytics.
- Power BI presents information to business users.
When functioning properly, this architecture enables organizations to analyze operational data without impacting the transactional ERP system. However, this layered design also introduces a critical operational challenge.
The Silent Failure Pattern
Most monitoring strategies focus on system availability rather than data movement.
Organizations commonly monitor:
- Power BI dataset refresh status
- Azure resource availability
- SQL database uptime
- Automation job execution status
While these checks are important, they do not verify the most critical question:
Is new data actually flowing through the pipeline?
Several conditions can interrupt data movement while leaving the infrastructure operational:
- Export processes that stop transferring new records
- Watermark or incremental load issues
- Data transformation jobs that stop updating reporting tables
- Automation schedules that fail silently
When these issues occur, the reporting environment may continue refreshing successfully using stale data. Because dashboards still load and reports continue to run, the issue often goes unnoticed until users observe that numbers are no longer changing. This can lead to days or even weeks of inaccurate reporting.
Why Traditional Monitoring Is Not Enough
Traditional monitoring tools focus on whether systems are running, not whether data is changing.
For example:
- A Power BI dataset may refresh successfully even if the underlying SQL tables contain no new data.
- A database server may be online even if export jobs stopped hours earlier.
- Automation schedules may execute without errors even though upstream processes failed.
From a monitoring perspective, the environment appears healthy. From a business perspective, however, the reporting platform is effectively frozen in time. This gap between system health and data health is one of the most overlooked risks in enterprise reporting pipelines.
Introducing Data Freshness Monitoring
To address this risk, organizations should implement a data freshness monitoring strategy alongside traditional infrastructure monitoring.
Instead of monitoring only system availability, the monitoring solution verifies whether expected data changes are occurring within defined time windows.
This approach focuses on questions such as:
- When was the last time new data arrived in a reporting table?
- Has a critical dataset stopped receiving updates?
- Are expected daily transactions still appearing in the reporting database?
If data has not changed within an expected timeframe, the monitoring system generates an alert. This approach ensures that silent pipeline failures are detected quickly.
A Practical Monitoring Architecture
One effective strategy is to implement a SQL-based monitoring framework directly inside the reporting database. The core idea is simple: maintain a configuration of monitored entities and periodically check whether new data has appeared within an expected time window.
A typical implementation includes three main components.
Configuration Layer
A configuration table defines the datasets to monitor and their expected update frequency.
Example configuration fields might include:
- Dataset name
- Monitoring category
- Expected update frequency
- Alert threshold (hours or days)
This allows different types of datasets to be monitored appropriately.
| Category | Example Use | Typical Threshold |
| Daily Critical | Transactional data | 24 hours |
| Daily Operational | Operational reporting | 48 hours |
| Weekly Master | Reference data | 7 days |
| Low-Change Reference | Rarely changing data | 30 days |
This structure allows the monitoring system to distinguish between datasets that should change frequently and those that change rarely.
Monitoring Logic
A scheduled stored procedure runs periodically to evaluate data freshness.
The procedure performs checks such as:
- Identifying the most recent record timestamp
- Comparing it with the current system time
- Determining whether the expected update window has been exceeded
If the time difference exceeds the defined threshold, the dataset is flagged as potentially stale. Each monitoring run records results in a history table for auditing and trend analysis.
Automation Layer
Automation tools such as Azure Automation runbooks can execute the monitoring procedure on a scheduled basis. A typical schedule might run every morning after nightly data loads complete. The automation layer retrieves monitoring results and evaluates whether alerts need to be generated.
Alerting and Notifications
When stale data conditions are detected, the monitoring system can trigger notifications through collaboration and messaging platforms.
Alerts typically include:
- Dataset name
- Last detected data timestamp
- Expected update threshold
- Time since last update
| Reporting Data Freshness Alert Dataset: Transactional Reporting Table Last Update Detected: 36 hours ago Expected Update Window: 24 hours Status: Data Freshness Threshold Exceeded |
This notification allows support teams to investigate issues immediately rather than discovering them days later through business reports.
Benefits of Data Freshness Monitoring
Implementing data freshness monitoring provides several operational advantages.
- It reduces the risk of silent reporting failures by detecting stalled pipelines early.
- It improves operational visibility across complex reporting architectures where multiple technologies interact.
- It allows support teams to identify problems in upstream processes before they impact business decision-making.
- It supports a more mature model of data observability, where the reliability of information pipelines is monitored just as carefully as system infrastructure.
Real-World Observation
In several enterprise environments, reporting issues are initially suspected to be caused by Power BI refresh problems or dashboard logic errors. However, deeper investigation often reveals that the reporting platform itself is functioning correctly while upstream data exports have stopped updating the reporting database.
Because dashboards continue refreshing successfully, the problem can remain unnoticed until business users detect inconsistencies in the data. That delay is exactly why proactive data freshness monitoring matters.
Final Thoughts
Reporting platforms built on Dynamics 365 Finance & Operations, Azure SQL, and Power BI are powerful tools for enterprise analytics. However, their reliability depends on more than just system uptime.
The most important question is not simply whether reports refresh successfully, but whether the underlying data pipeline continues to deliver fresh information. By implementing proactive monitoring strategies that verify data movement, organizations can protect their reporting environments from one of the most common and costly hidden risks in enterprise analytics.
Helpful References:
You can also explore our earlier insight on reporting pipeline behavior in D365 F&O Weekly Insight – Week 9.
Microsoft documentation also describes best practices for monitoring Dynamics 365 data export pipelines.